XLK · 30.5%XLF · 13.4%XLV · 11.2%XLY · 10.8%XLC · 9.1%XLI · 8.4%XLP · 6.0%XLE · 3.8%XLU · 2.6%XLRE · 2.2%XLB · 2.0% ETFSetups

Did the whole sector move, or just two big names?

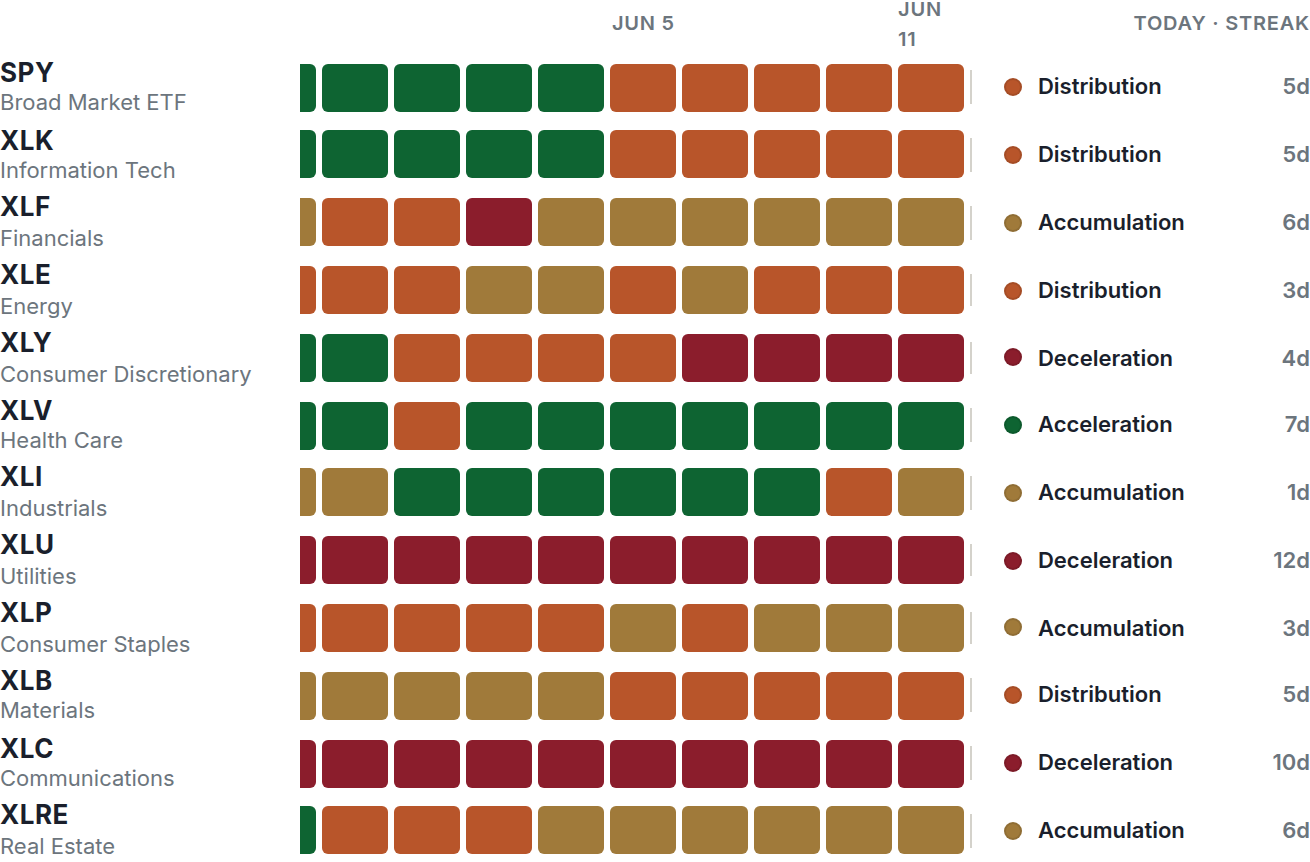
Sixty sessions of daily regime for every sector in one grid, with how much of the S&P 500 each one carries. Open a sector to see its ten largest holdings on the same grid, each with its weight, and you’ll know straight away.

etfsetups.com/heatmap/
Sixty sessions of sector regime with SPY weights and a drill-down

A real screen from the member area, captured today. Not a mockup.

Technology moved. Was that the sector?

12.7%
AAPL, of XLK
14.1%
NVDA, of XLK
60.7%
its ten largest, combined

Two names carry 26.7% of Information Technology. When the sector turns, the grid tells you in one click whether the whole group moved or whether those two dragged it, which is the difference between a rotation and a headline.

One day of color doesn’t tell you much.

A run of them does. You can see whether a regime is holding steady or flipping back and forth, and when a long red stretch finally turns, that’s what the Trend Reversal setup fires on. The grid is built so you can spot those turns without reading a single number.

etfsetups.com/heatmap/
Sixty sessions of regime for every sector

How to read the grid

Across a row: is this steady?

A sector that’s held one color for weeks is trending. One that flips between colors every few days is chopping, and chop is where mechanical systems bleed money. The row shows you which one you’re looking at.

Down a column: is this the market?

One sector turning green is a sector story. Most of the column turning in the same week is a market story, and the setups that fire after it tend to be worth more.

Green doesn’t mean you can buy it.

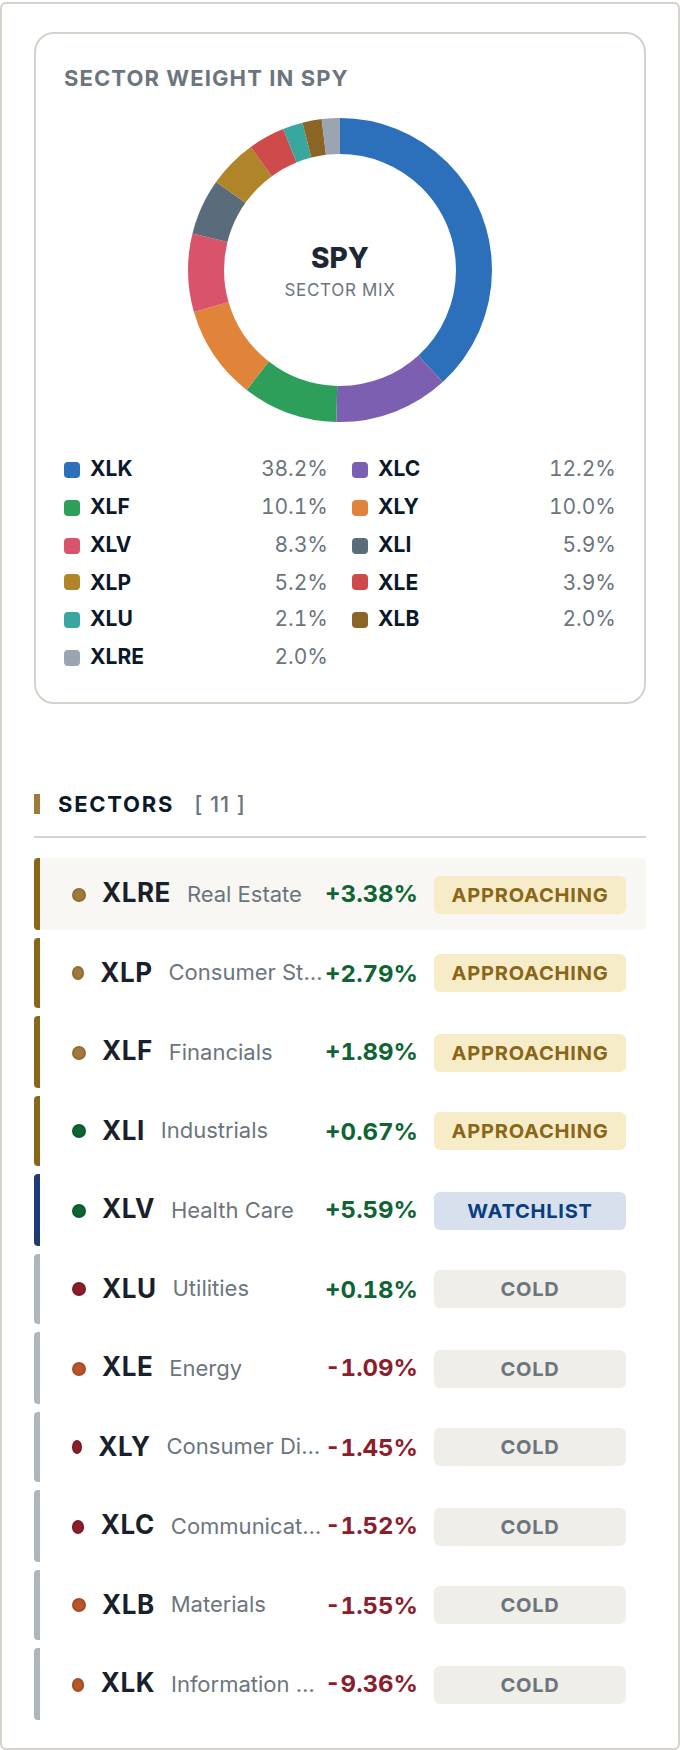
A sector can be green for weeks and still be a bad place to put money this morning, because price has already run a long way from the line we enter against. The readiness column tells you which one you’re looking at, in plain words, next to the distance behind it.

etfsetups.com/explore/
Distance from the pulse line and readiness for every sector

Have a look at today’s board.

The track record is public, so you can check how it’s gone before you pay us anything. The screens above are what you get if you join.

Developers: get API access to our signals